Available plots
Here is the list the available tools to assess your products: MAP_DIFFERENCE, MAP, BOXPLOT, SCATTER, HISTOGRAM, HISTOGRAM_DIFFERENCE, HISTOGRAM_2D.
Example using this configuration file:
plot = MAP_DIFFERENCE, MAP, BOXPLOT, SCATTER, HISTOGRAM, HISTOGRAM_DIFFERENCE, HISTOGRAM_2D
var = rfb
output_folder = ../outputs/
monthly = False
north = True


[product_main] # Main product description here
    title = SAMOSA
    path = ../database/NH/SIT-E2a_satellital_observations_ku-band/Ku_CryoSat-2/LEGOS/SAMOSA/*/*.nc

[product_slave] # Slave product description here
    title = TFMRA50
    path = ../database/NH/SIT-E2a_satellital_observations_ku-band/Ku_CryoSat-2/LEGOS/TFMRA50/*/*.nc
METRICS
The metrics are always calculated:
SAMOSA :
    Mean : 0.09679521
    Median : 0.10742554
    Standard Deviation : 0.12039979
    Variance : 0.0144961085

TFMRA50 :
    Mean : 0.100291334
    Median : 0.078165345
    Standard Deviation : 0.1229836
    Variance : 0.0151249645
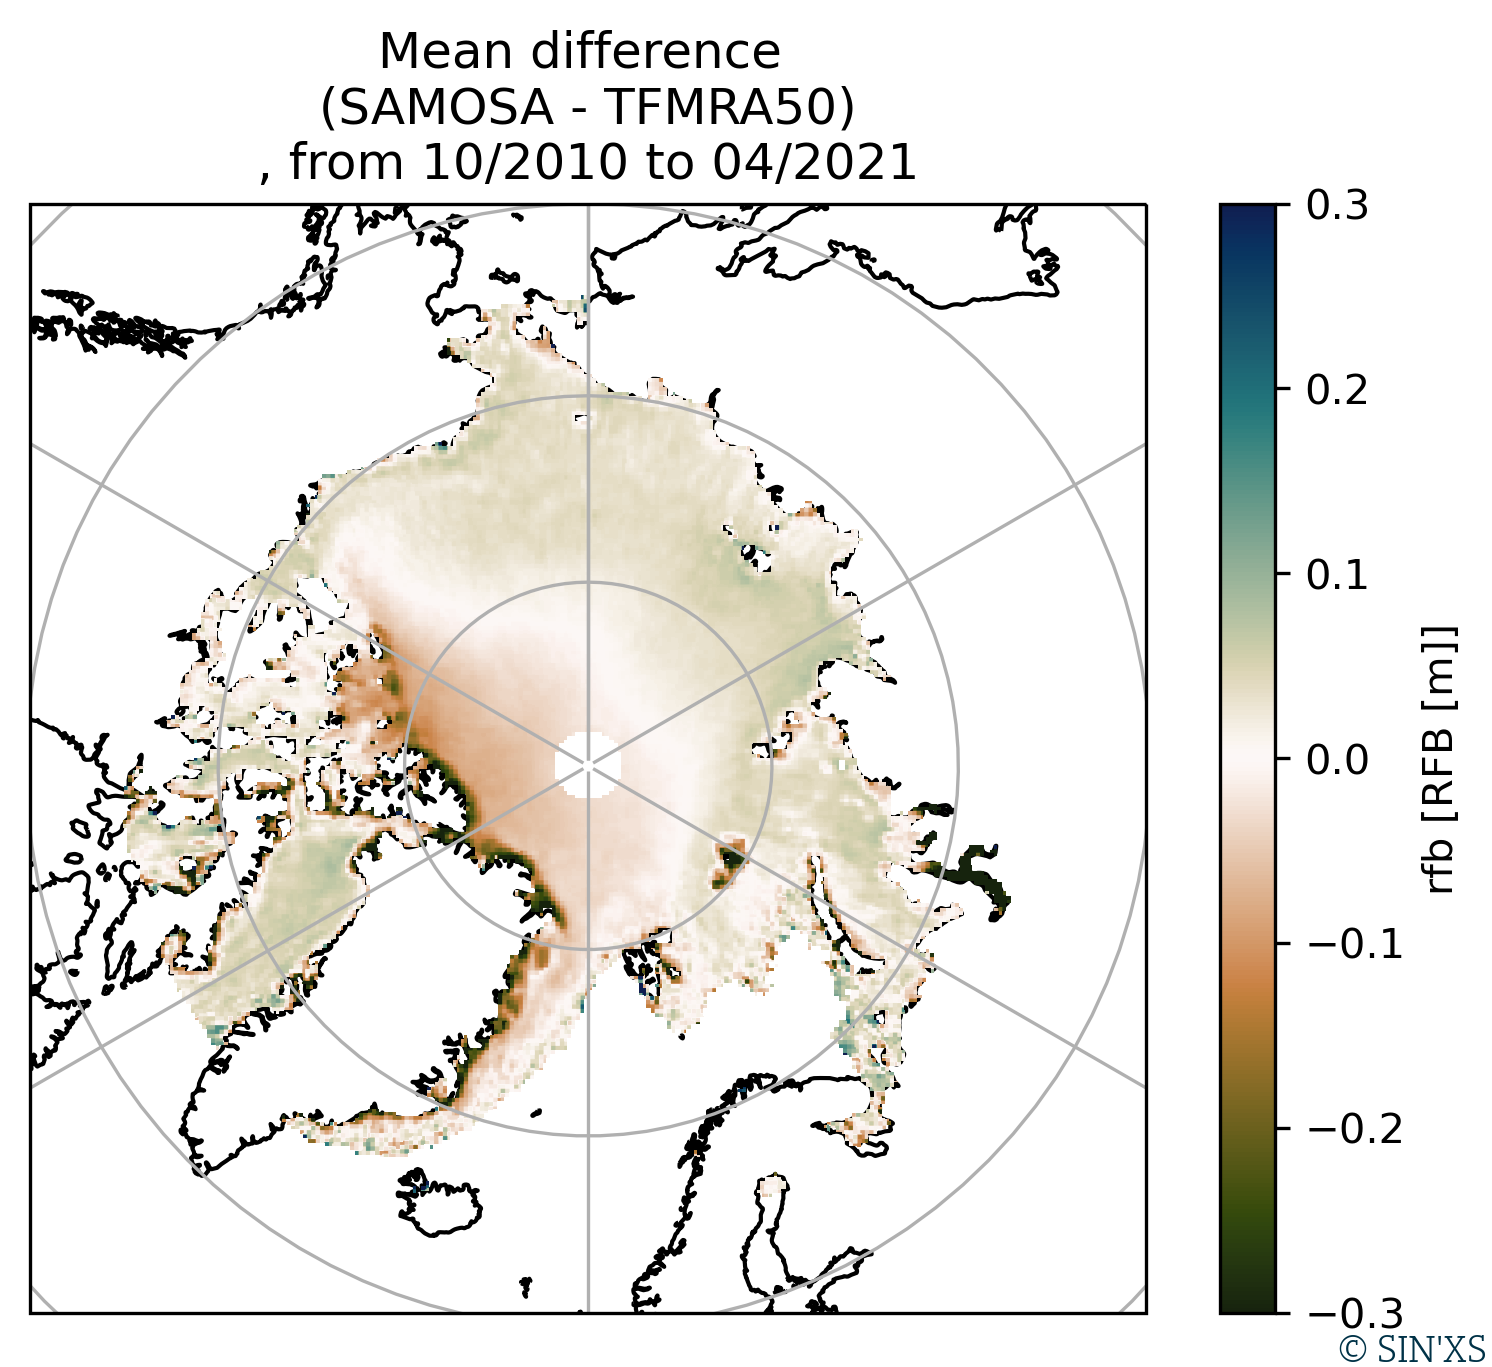
MAP_DIFFERENCE
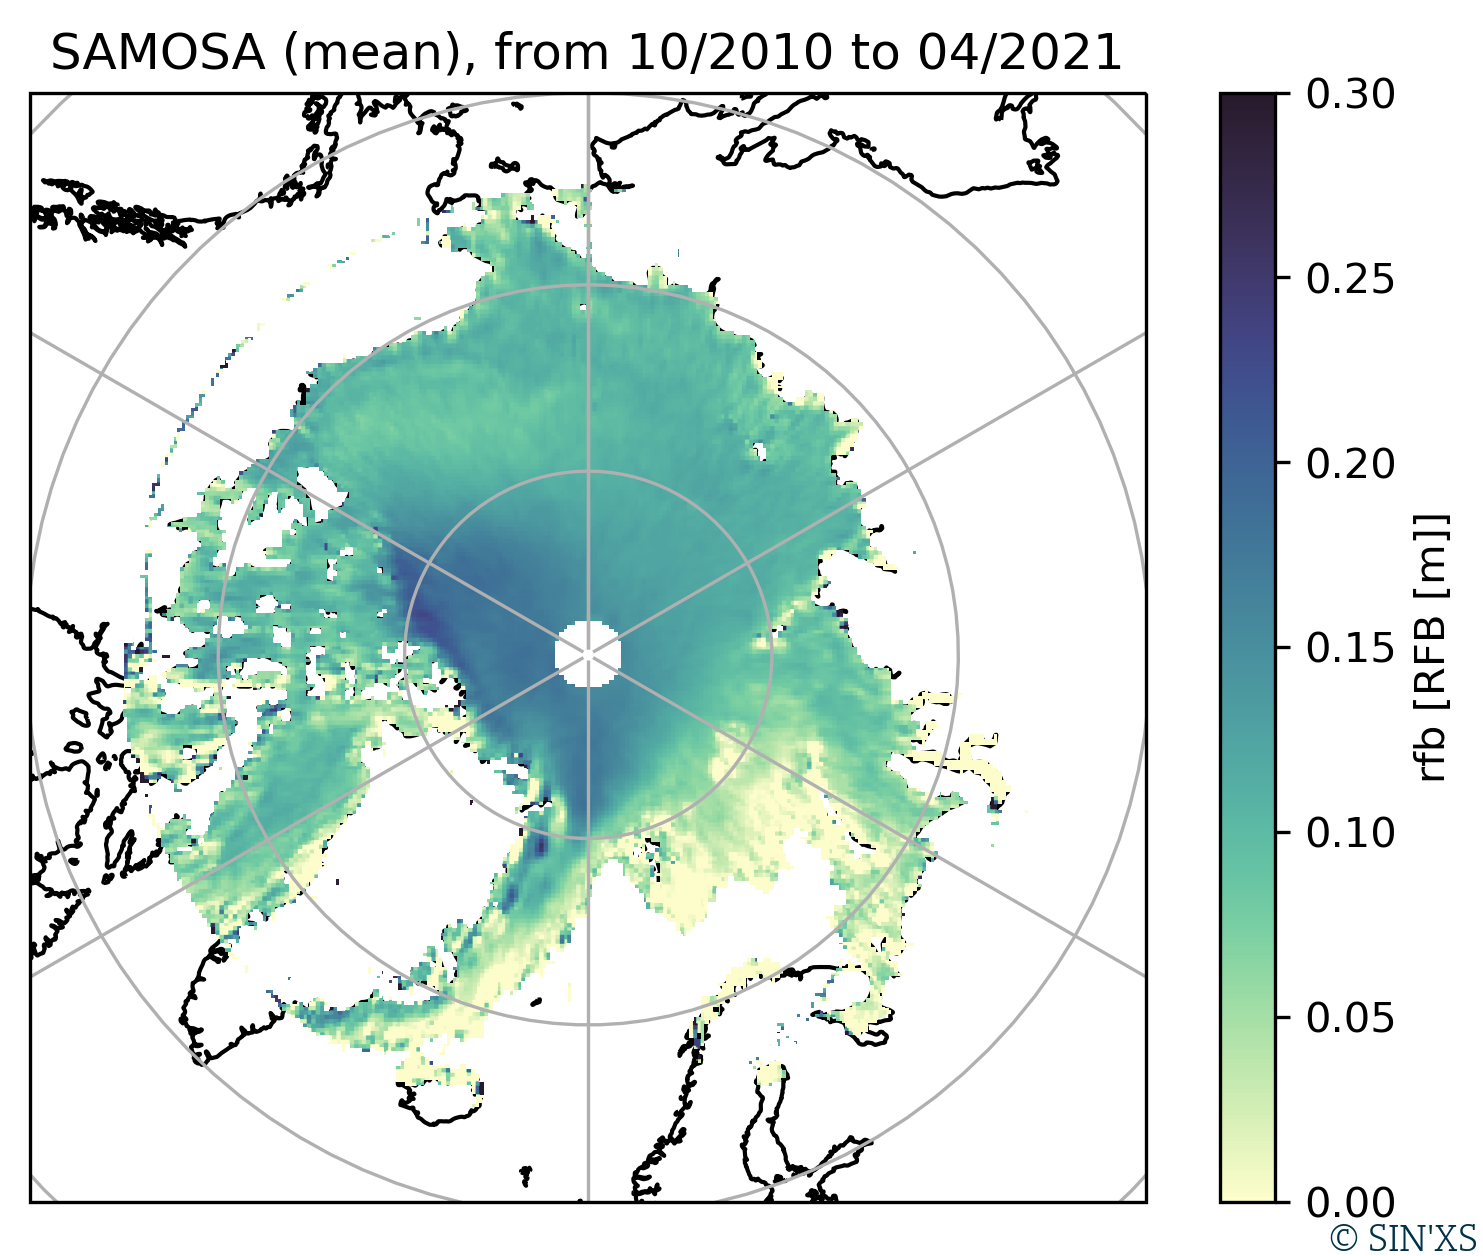
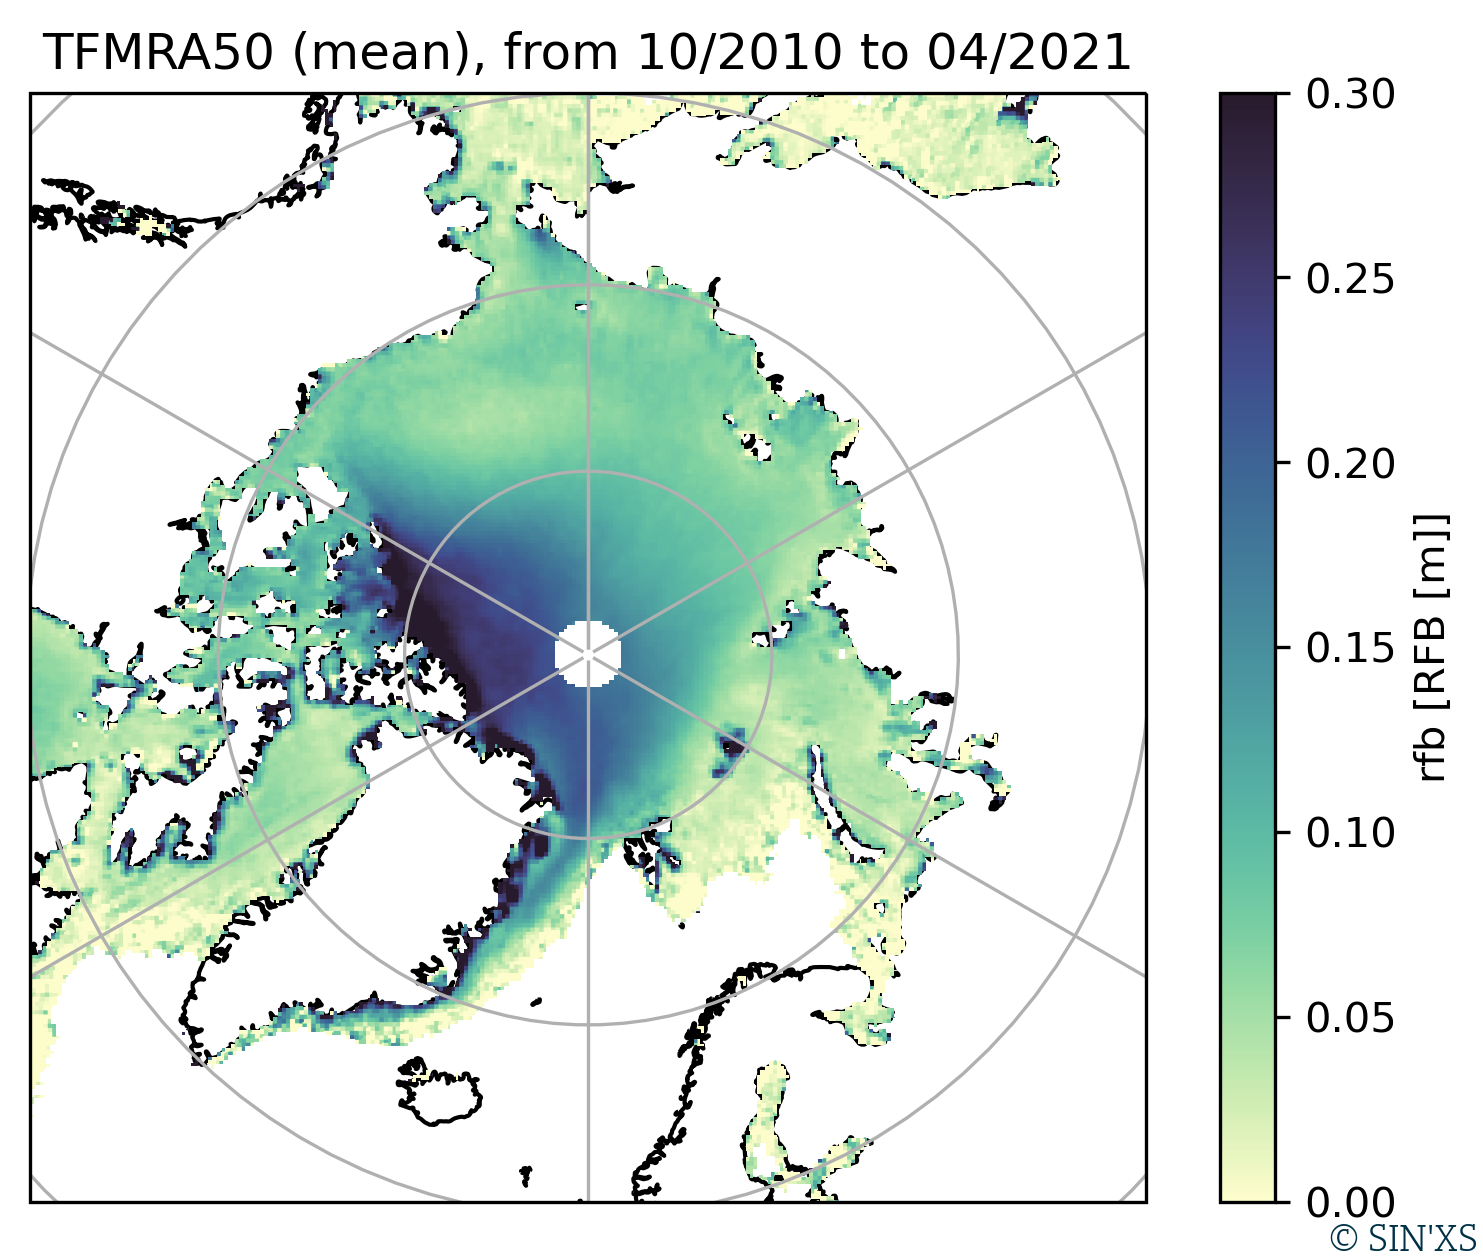
MAP
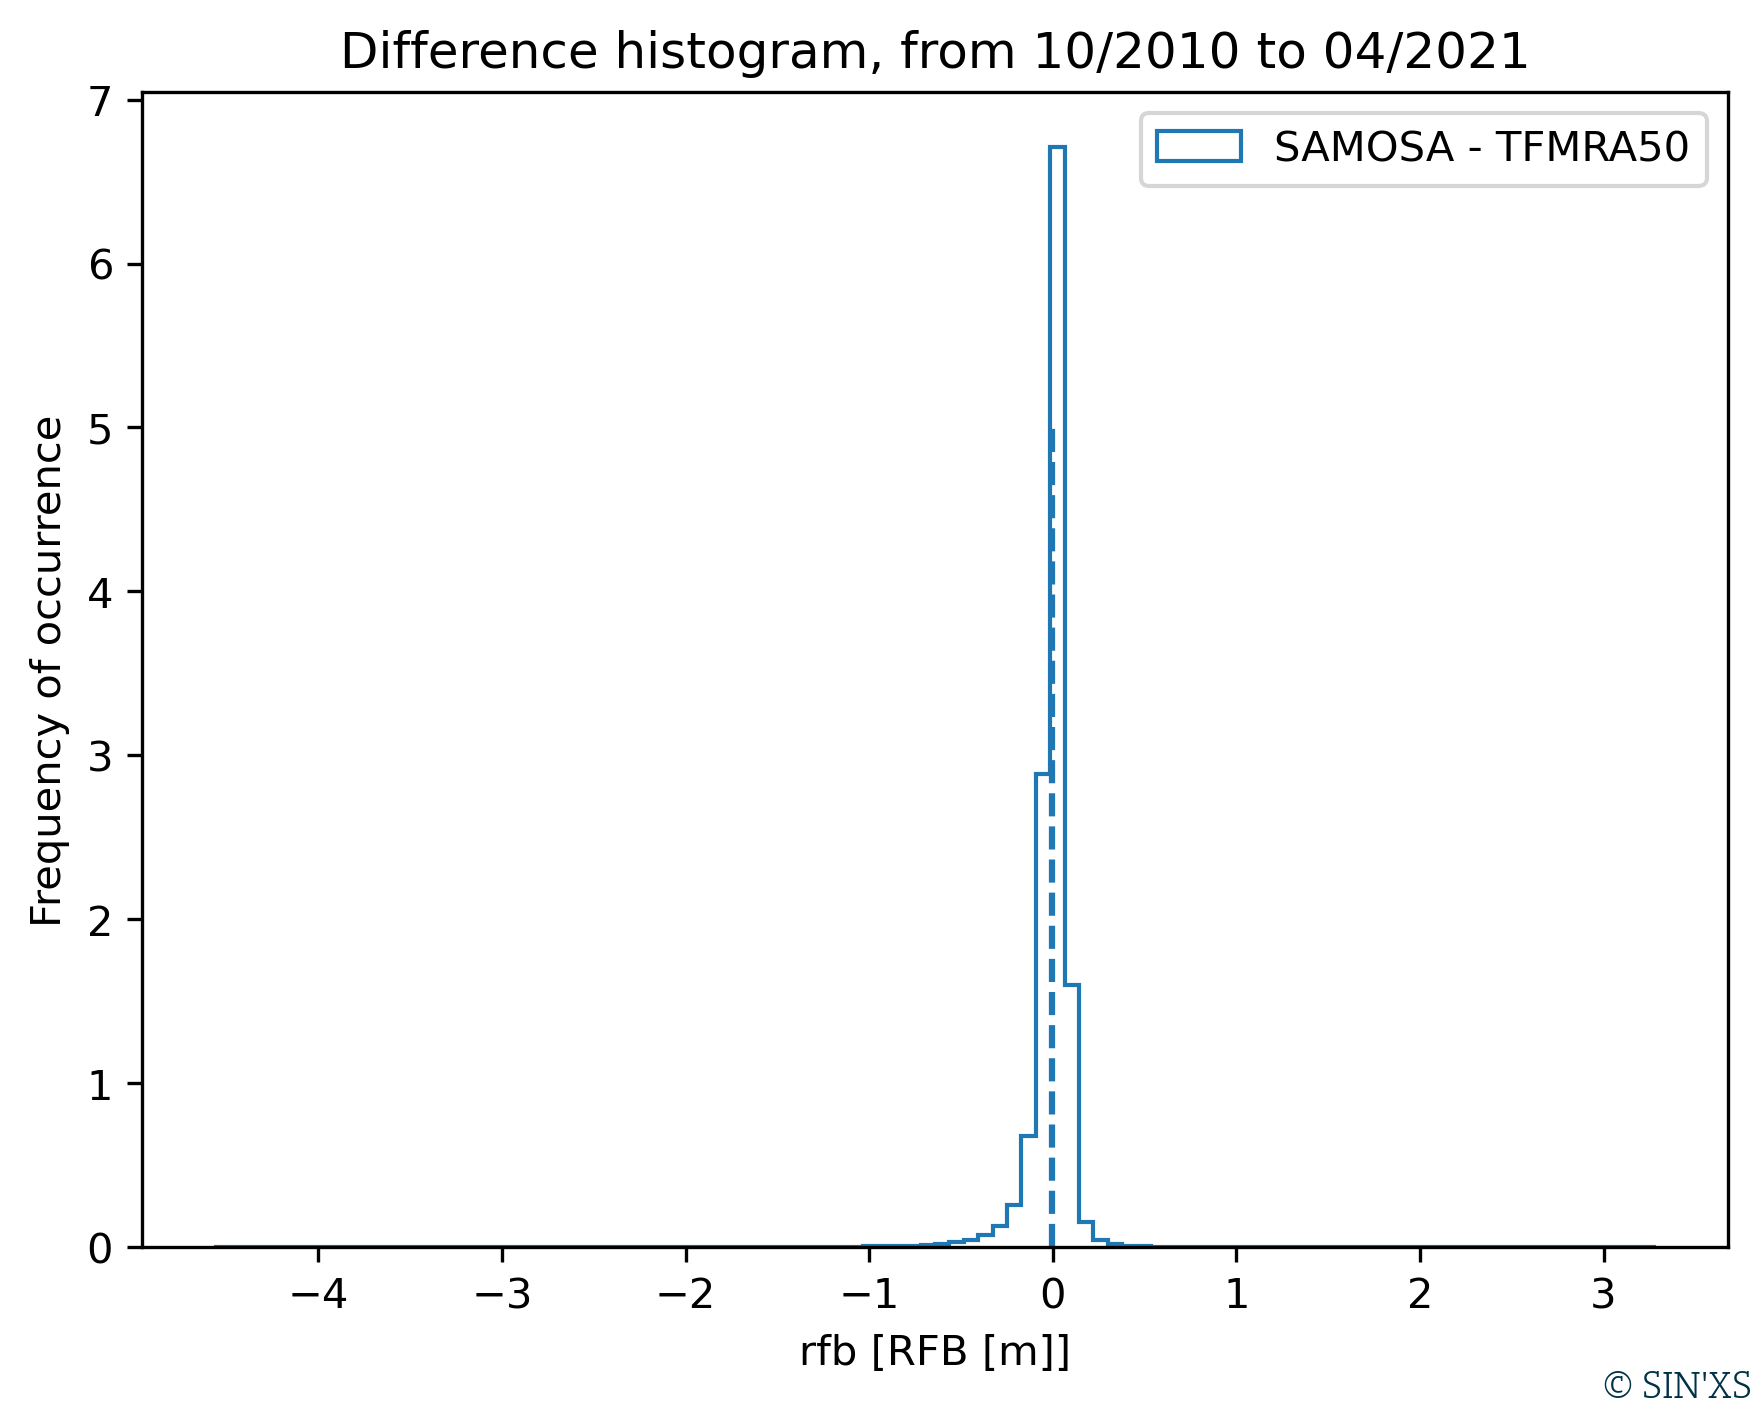
HISTOGRAM_DIFFERENCE
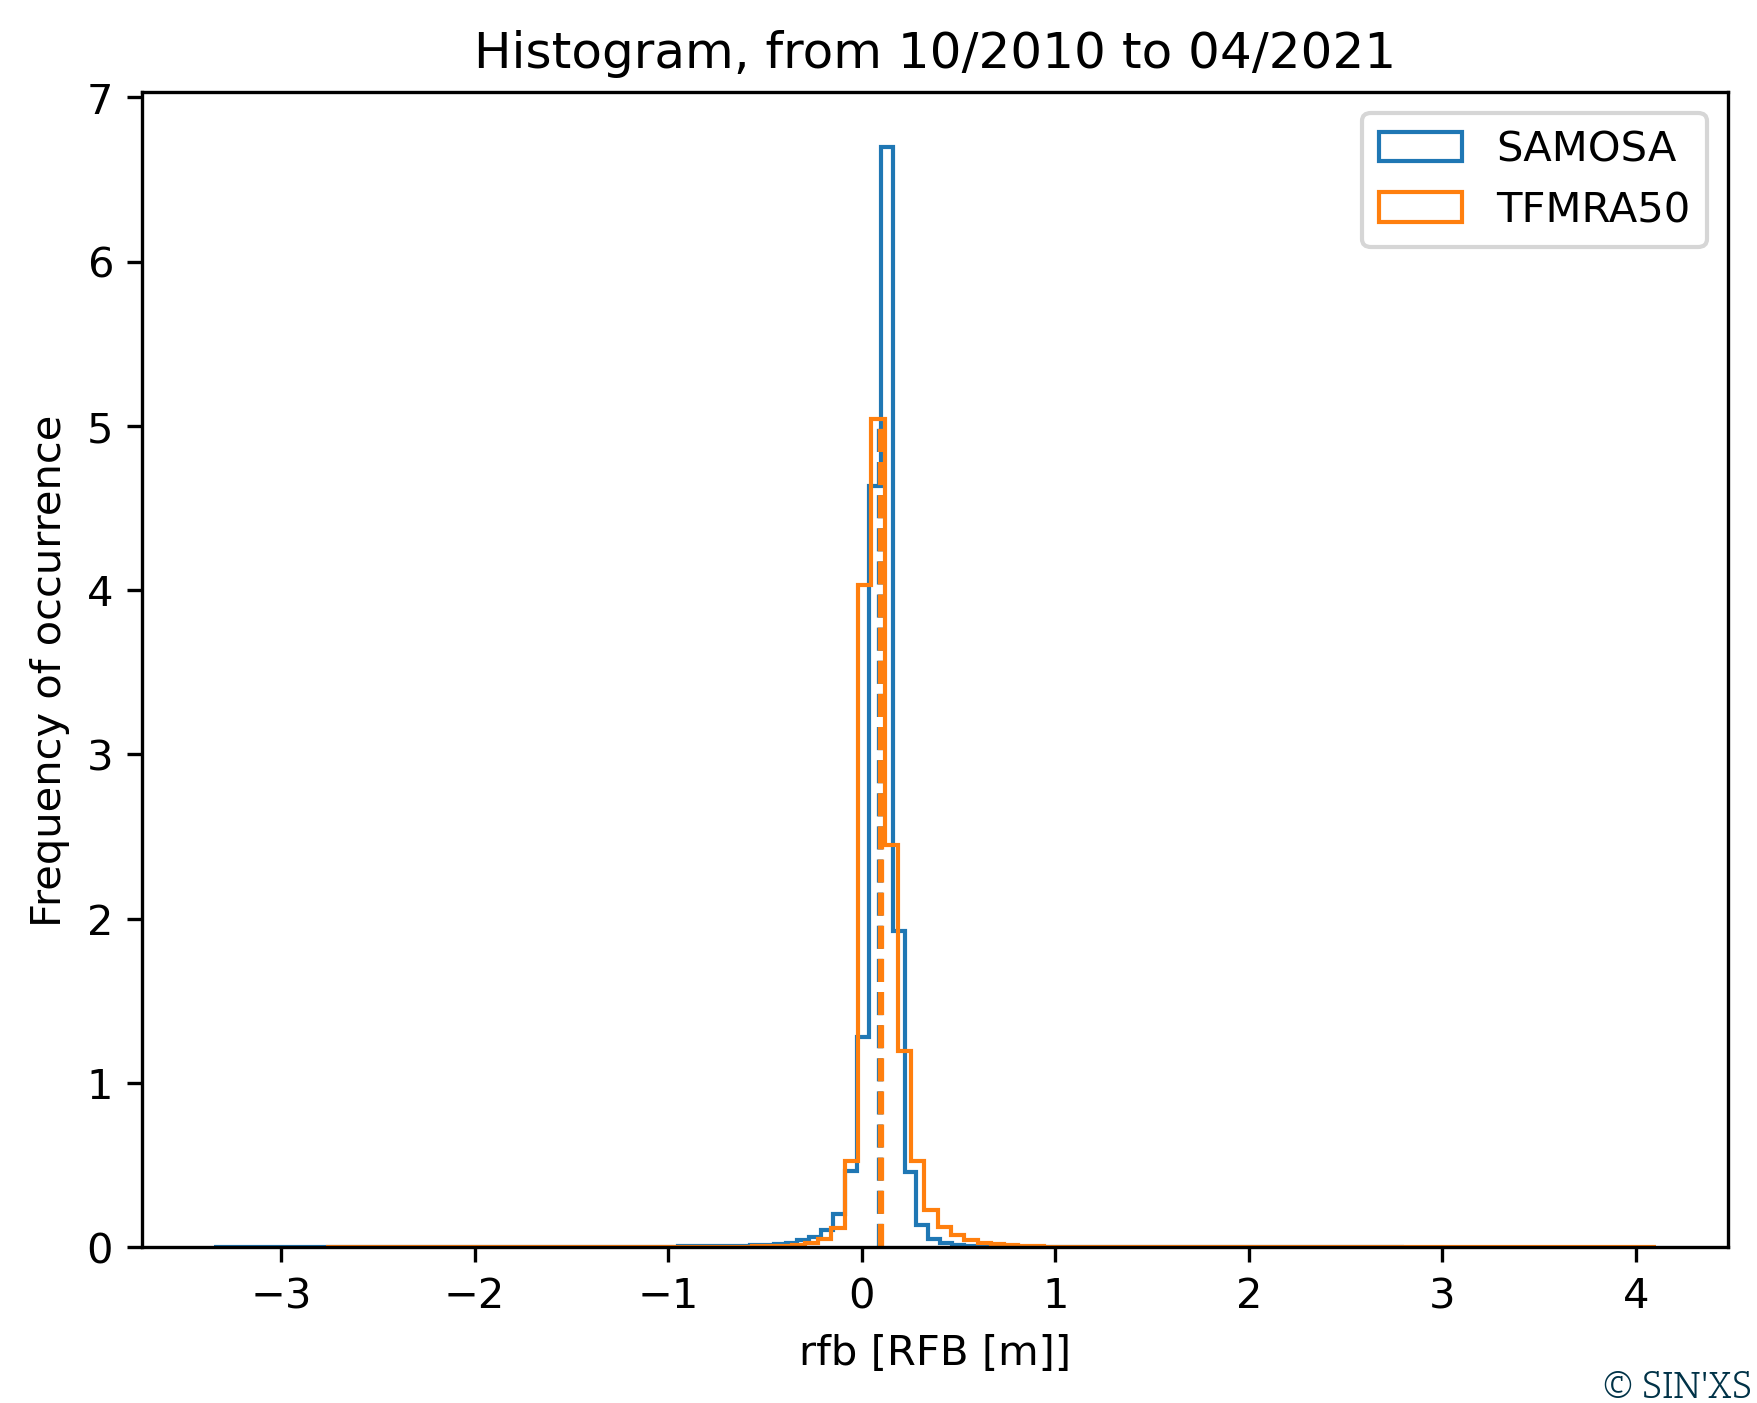
HISTOGRAM
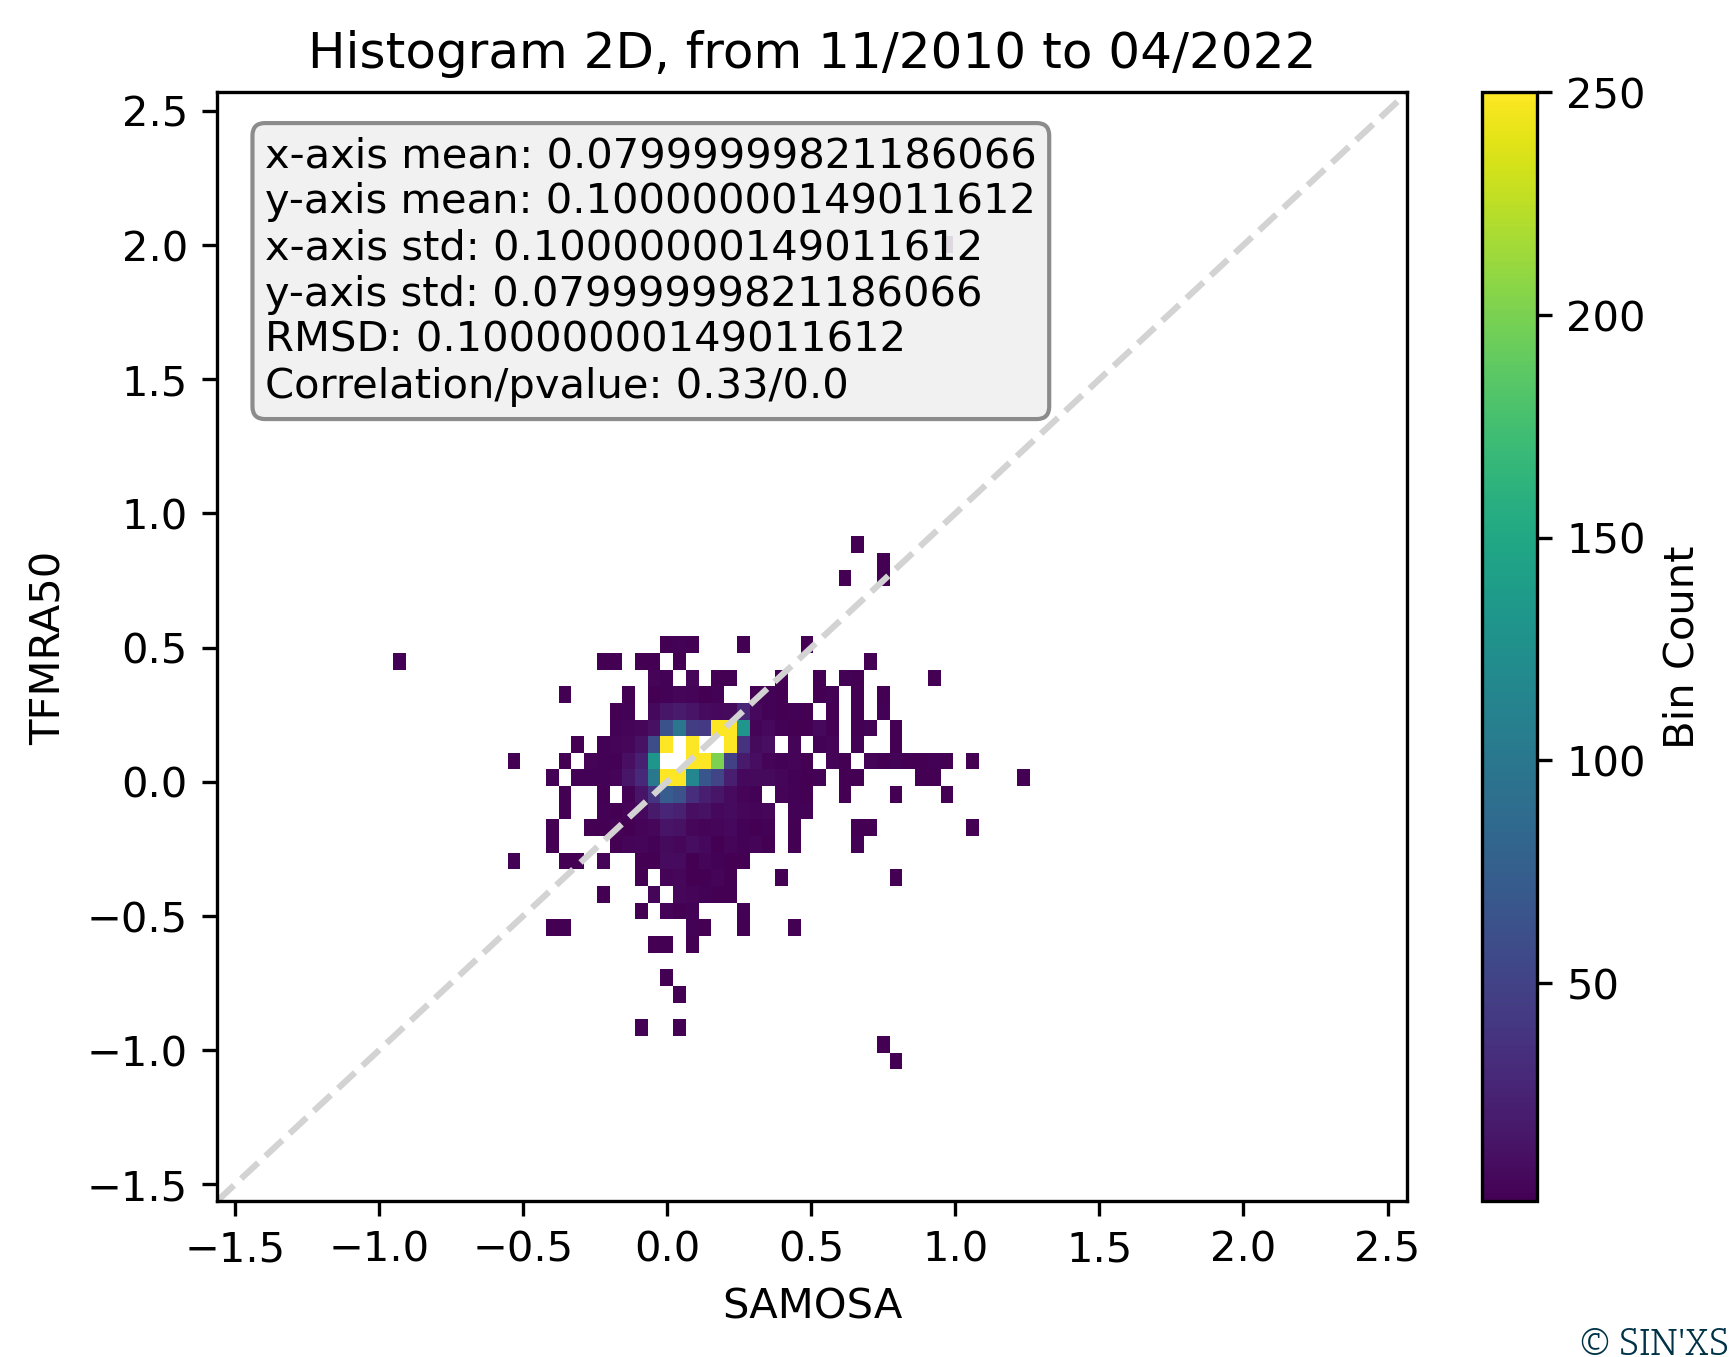
HISTOGRAM_2D
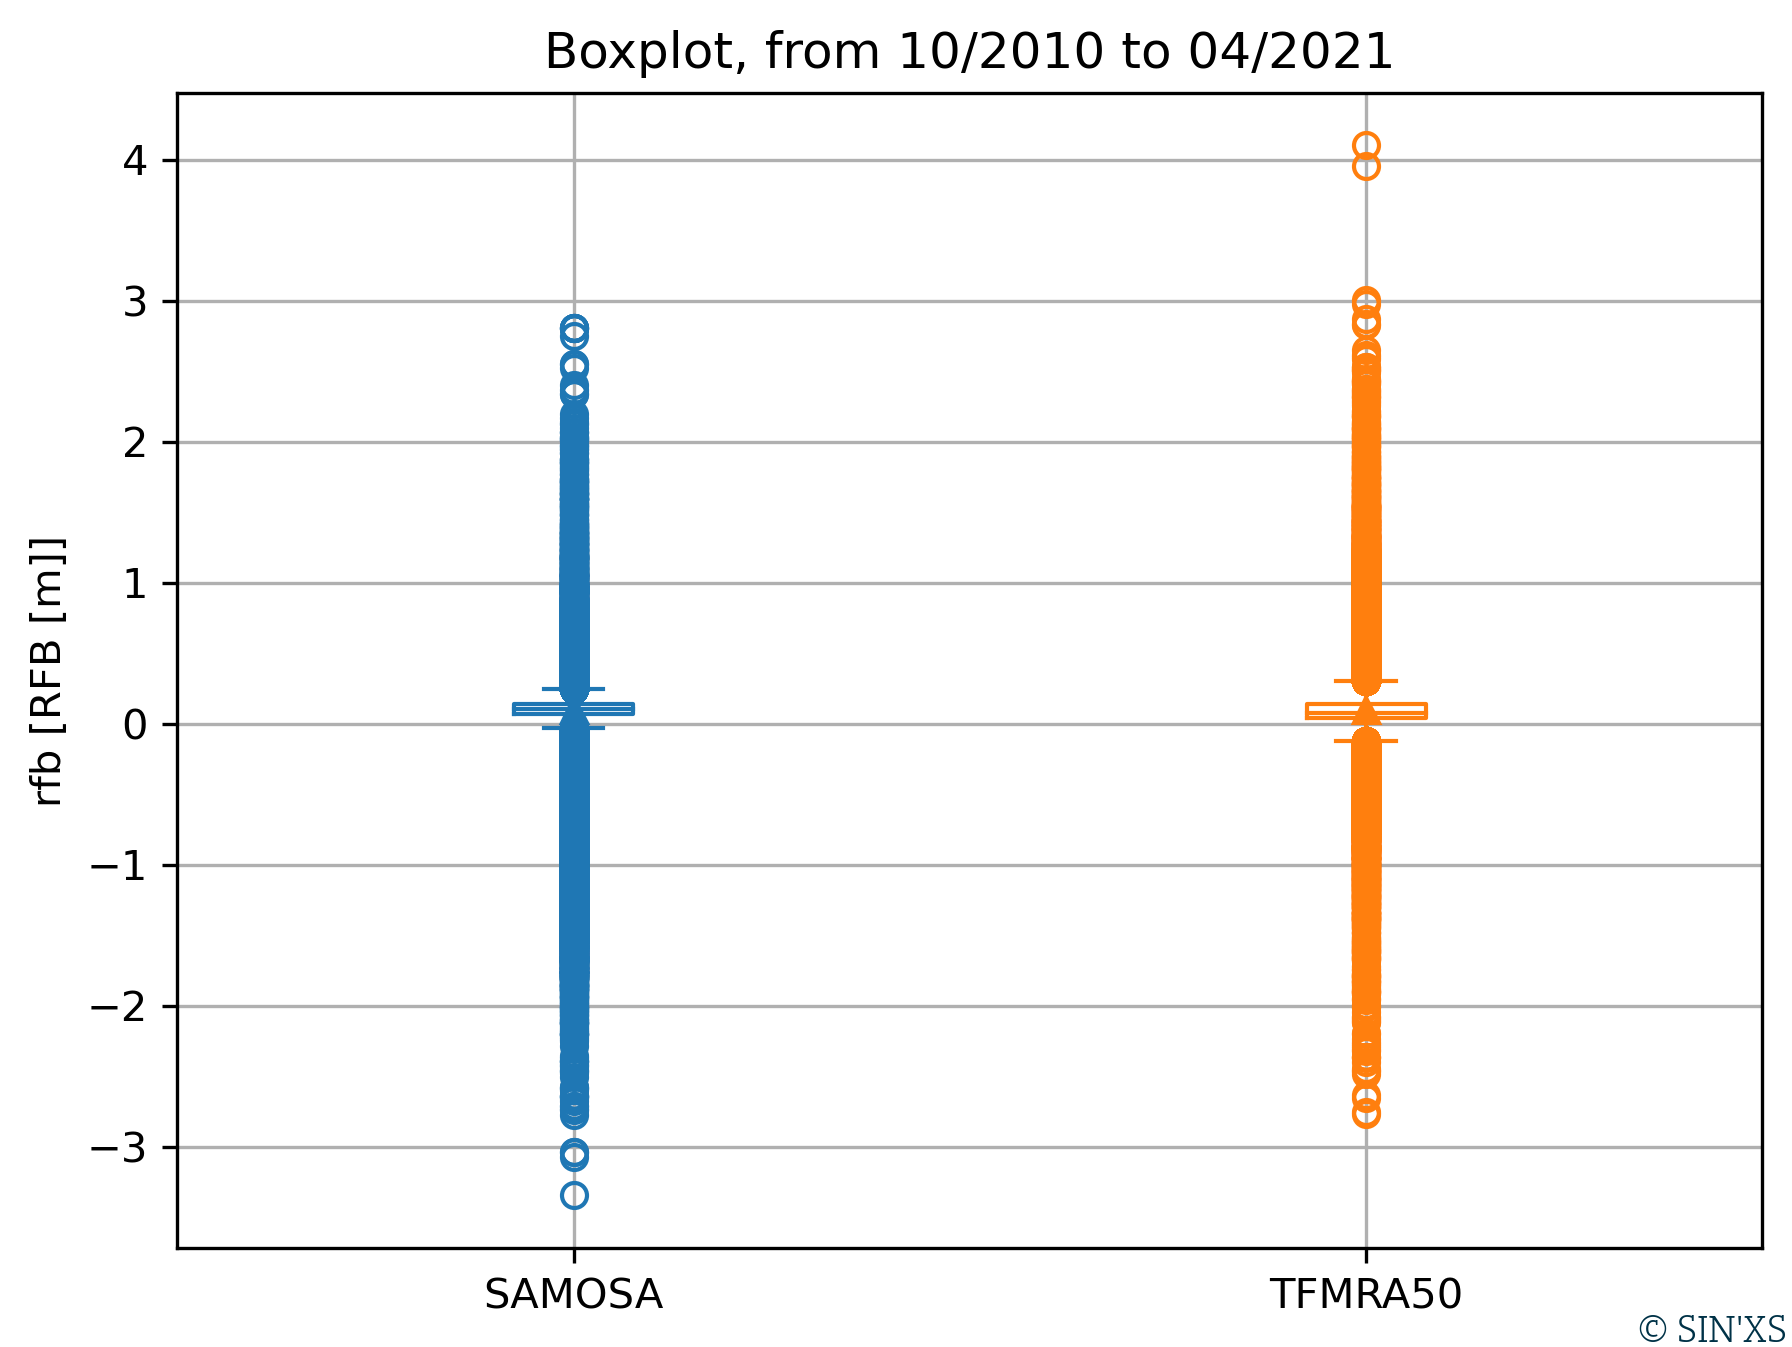
BOXPLOT
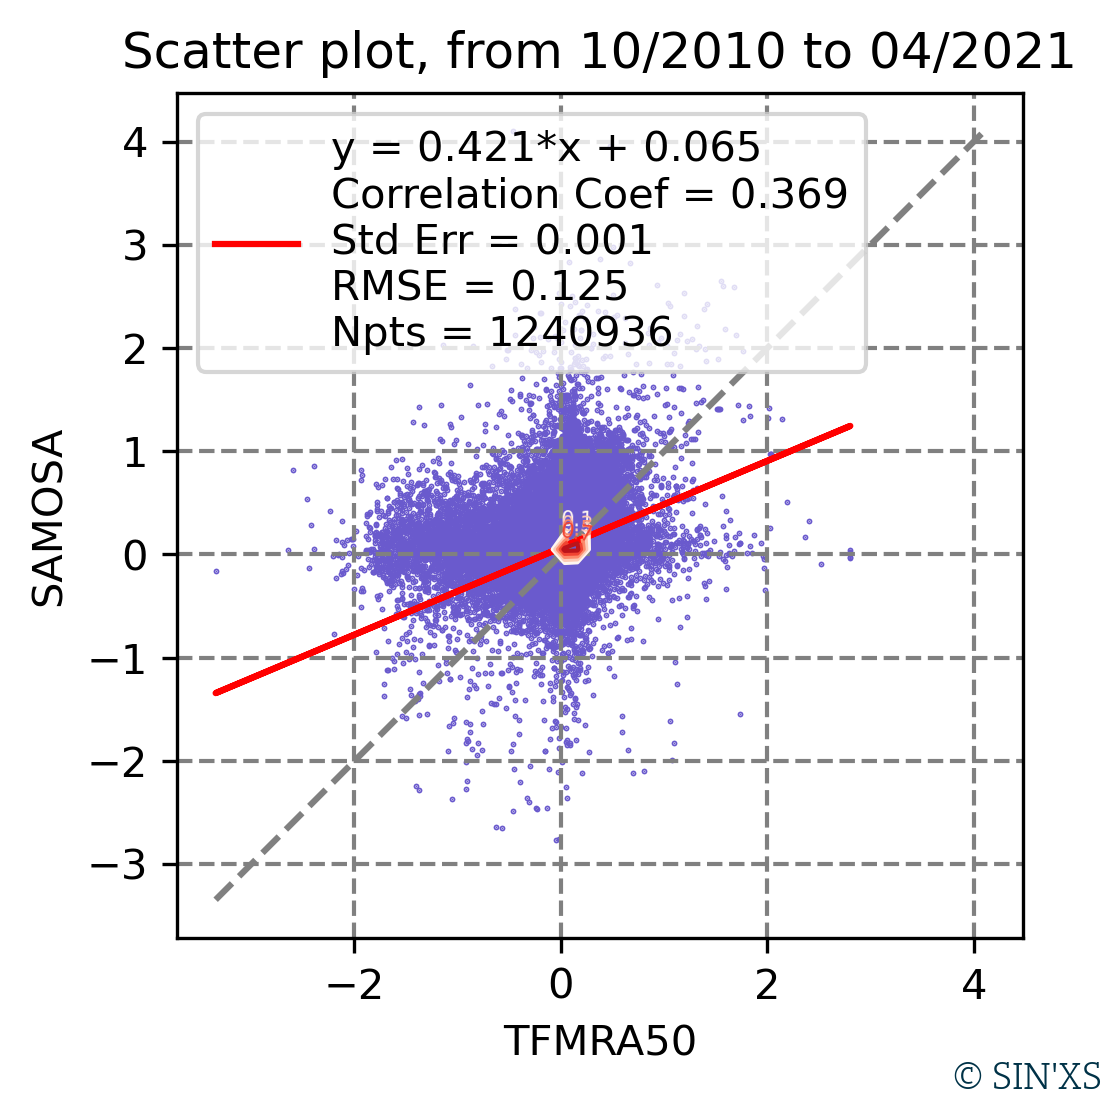
SCATTER